Measurement & ROI
How to Measure ROI on Brand Activations: A Framework for Ottawa Marketers
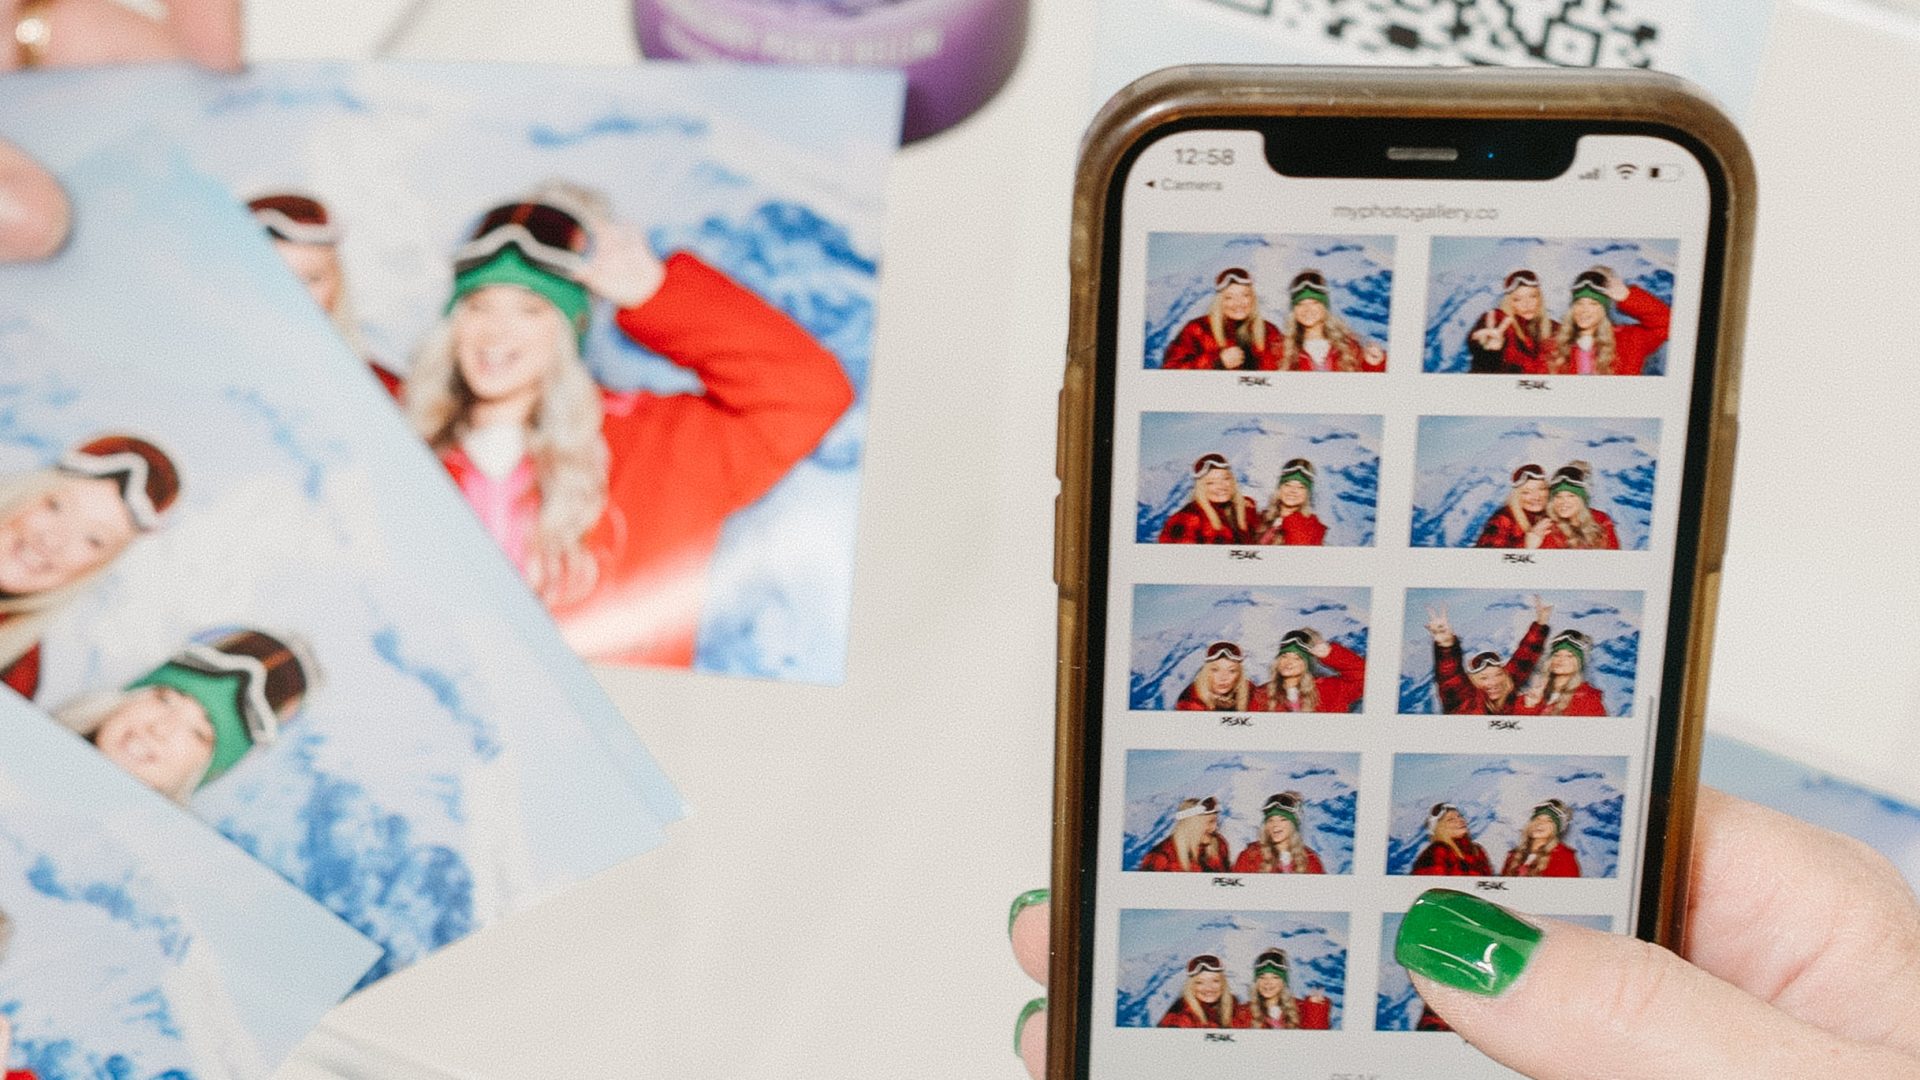
Your CMO loved the activation photos. Your CFO wants to know what the activation produced.
This is the framework Ottawa marketing teams use to measure brand activation ROI in numbers a finance team will sign off on.
The Three Metrics That Matter
Forget vanity stats. Three numbers run the conversation:
1. Cost per branded impression. Total activation cost divided by (captures × shares × average reach). This is your direct comparison to paid digital.
2. Opt-in conversion rate. Of guests who interacted with the activation, what percentage gave you their email, phone, or scanned their badge. This is your owned-channel growth.
3. Attributed pipeline or sales lift. Demos booked, products sold, donations pledged, leads closed — tracked back to the activation through unique UTMs, QR codes, or CRM tagging.
Every other metric is supporting evidence. These three carry the budget defense.
The Math Worked End to End
A $15K Signature-tier activation in Ottawa over an 8-hour event window.
Captures: 420 unique guests
Share rate to social: 62% = 260 shares
Average reach per share: 240 followers
Total branded impressions: 62,400
Cost per branded impression: $0.24
Opt-in rate: 58% = 244 emails captured
Lead-to-meeting conversion (B2B context): 8% = 19 meetings booked
Meeting-to-deal conversion: 15% = 3 deals at an average $18K = $54K pipeline
Direct attributed pipeline: 3.6x activation spend
Numbers like these are why Ottawa marketing leaders are quietly moving budget out of paid social and into experiential.
How to Track It Live (Not After the Fact)
The mistake most teams make is trying to reconstruct attribution after the event. The activation is already over. Data is messy. CFO is skeptical.
Better approach: instrument the activation before it goes live.
Every share screen tagged with a unique UTM. Every opt-in form flowing directly into your CRM with a campaign tag. Every QR code on the printed share asset routing to a campaign-specific landing page. A live dashboard the marketing team and the C-suite can both watch during the event.
When the activation ends, the data is already clean. Recap deck lands within 72 hours, not 3 weeks.
Worked Example: A Trade Show Booth That Paid for Itself
A B2B tech company sponsoring an Ottawa conference invested $18K in an AI cover-story booth. 1,840 captures across three days. 71% opted into a demo calendar link. Sales booked 84 discovery calls in the two weeks after the event. Closed pipeline attributed at $400K within the quarter.
22x return on activation spend. That’s a defensible line item.
What to Bring to the Quarterly Review
One slide. Three metrics. One sentence per metric.
“We captured 420 guests at a cost per branded impression of $0.24 — 4x more efficient than our Meta benchmark. We added 244 opted-in contacts to the funnel. We attributed $54K in pipeline directly to the activation, a 3.6x return on spend.”
If you can’t fit your activation results into that slide, you didn’t measure them right.
FAQ
What’s a good share rate for a brand activation?
50-65% is the benchmark for a well-designed activation. Below 40% means the share asset isn’t strong enough or distribution friction is too high. Above 75% usually indicates a particularly viral format like AI character cards or magazine covers.
How long should I track attribution after the activation?
30 days for B2C sales lift, 90 days for B2B pipeline. Anything beyond 90 days starts to attribute incorrectly to other channels.
Can you measure brand lift from an activation?
Yes, but it requires pre/post brand tracking surveys. For most Ottawa marketers, sticking to the three core metrics (cost per impression, opt-ins, attributed pipeline) is more defensible than brand-lift studies that take 6 months to validate.
Planning an Ottawa activation?
Two ways in:
Get a recommendation in 60 seconds — answer four questions, we send back the right experience for your event.
Book a 20-minute strategy call — for activations over $10K or anything that needs custom build.